News / Ball Python Morph Calculator: How to Read Resul...
Ball Python Morph Calculator: How to Read Results (2026)
- A ball python morph calculator shows statistical probabilities per egg, not guarantees. Small clutch sizes mean variance is high.
- Understanding recessive, incomplete dominant, and dominant inheritance is required before calculator output means anything.
- Standalone calculators do not connect to your collection, track historical results, or account for market value.
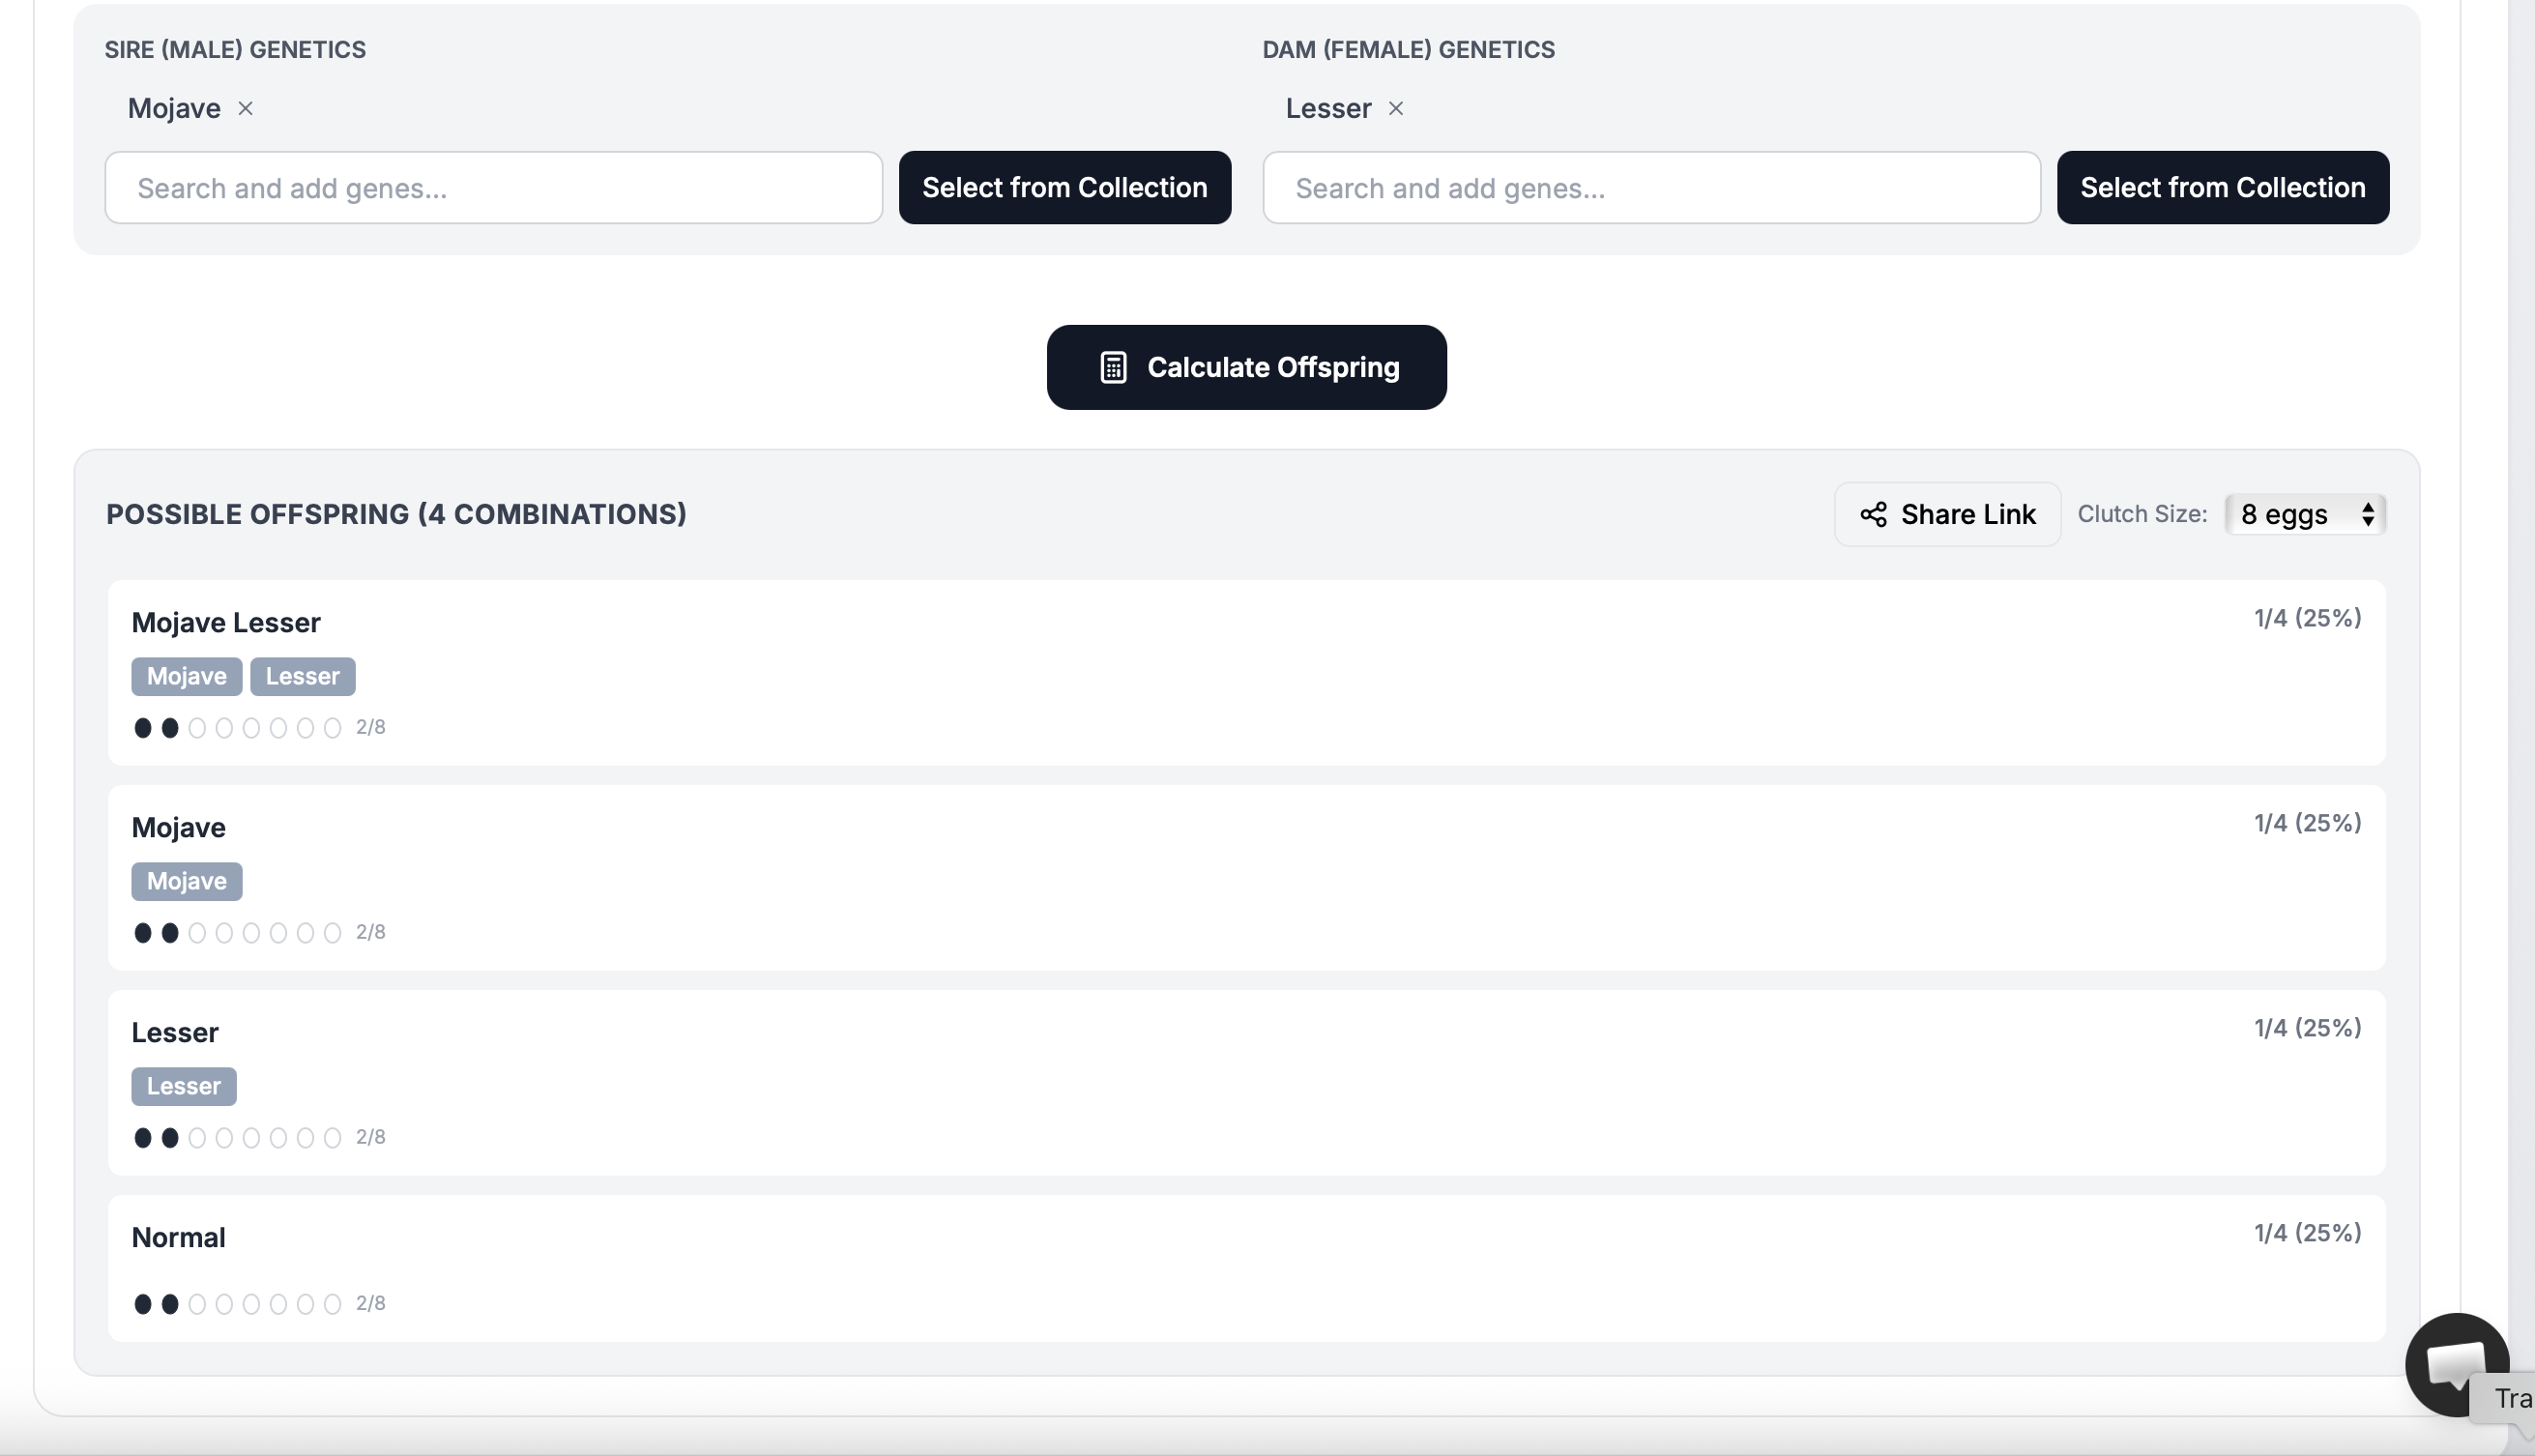
- THE RACK's genetics calculator pulls directly from your animals. No re-entering data. No checkbox mistakes.
You are looking at a Pastel het Puzzle male. The genetics are proven. The lineage is clean. But before you commit, you need to answer one question: what will he produce when paired to the females already in your collection? A ball python morph calculator gives you the answer before you spend a dollar.
Morph calculators are one of the most searched tools in the ball python community. And for good reason. When you are planning pairings, the difference between a 25% chance and a 0% chance of hitting your target morph is the difference between a profitable season and an expensive lesson. The math matters. Understanding what the math is telling you matters more.
This is how ball python genetics predictions work, how to read calculator output without fooling yourself, and where calculators stop being useful on their own.
How Ball Python Genetics Inheritance Works
Every ball python carries two copies of each gene; one from the sire, one from the dam. How those genes express visually depends on the inheritance type. There are three categories, and getting them wrong will cost you entire breeding seasons.
Recessive Genes
Clown. Pied. Axanthic. Desert Ghost. These genes are invisible unless the animal carries two copies. One copy from each parent. An animal with a single copy is a het; it carries the gene but shows no visual sign of it. Two hets paired together give you a 25% statistical chance of producing a visual offspring, a 50% chance of producing more hets, and a 25% chance of producing normals with no copies at all.
The tricky part: hets and non-carriers look identical. You cannot tell them apart by eye. A ball python morph calculator shows you the probability breakdown, but the only way to prove out a het is to breed it and see what comes out the other side. Or use a visual animal in the pairing to shift the odds.
Incomplete Dominant Genes
Pastel. Yellowbelly. Fire. Cinnamon. These genes are visible in a single copy. One copy gives you the standard form; Pastel, for example. Two copies give you the super form; a Super Pastel. The visual difference between single-copy and double-copy animals is distinct, and a ball python genetics calculator will map out the exact probability of each outcome.
Pair a Pastel to a normal and you get a statistical 50/50 split: half Pastels, half normals. Pair two Pastels together and the math shifts to 25% Super Pastel, 50% Pastel, 25% normal. These ratios hold across large sample sizes. In a single clutch of six eggs, you might see something very different. More on why in a moment.
Dominant Genes
Pinstripe. Spider. These genes express visually with one copy, and there is no super form. A single copy and a double copy look the same. The inheritance math is straightforward: pair a dominant morph to a normal and half the offspring will carry the gene. But because there is no visual distinction between one copy and two, dominant genes are less common in complex multi-gene projects where breeders need to know exact copy count.
Het, Visual, and Possible Het
These labels show up in every ball python pairing calculator result, and misunderstanding them leads to pricing mistakes and breeding miscalculations.
- Visual. The gene is expressed. You can see it. A Clown ball python is a visual Clown; it carries two copies of the recessive Clown gene.
- Het (heterozygous). The animal carries one copy of a recessive gene. It is not visible. A "het Clown" looks like a normal but carries one Clown allele. Proven through test breeding or parentage.
- Possible het (pos het, 50% het, 66% het). The animal has a statistical probability of carrying a het gene based on the pairing it came from. A 66% possible het Pied came from a pairing where both parents carried at least one copy, and the offspring is not a visual. Two out of three non-visual offspring from het x het pairings will be hets. One out of three will carry no copies at all. The percentage tells you the odds, not the answer.
Know Your Inheritance Types
Recessive. Incomplete dominant. Dominant. Every pairing decision starts here. Get the inheritance type wrong and the calculator output means nothing.
Reading Calculator Output Without Fooling Yourself
A ball python offspring calculator gives you probabilities. Percentages. Statistical expectations. Here is where most breeders trip up: they treat those percentages as promises.
A 25% chance of producing a visual Pied does not mean one in every four eggs will be a Pied. It means each individual egg has an independent 25% chance. Roll a die four times and you might never land on the number you want. Roll it twenty times and the distribution starts to smooth out. Genetics works the same way.
Clutch Size Changes Everything
Ball pythons produce small clutches. Four to eight eggs on average. With a 25% probability per egg, a clutch of six gives you roughly an 82% chance of getting at least one visual. Good odds, but not a guarantee. A clutch of four drops it to about 68%. If you are banking your entire season on hitting a specific morph from a single pairing, those numbers need to be part of your decision.
Breeders running larger programs with multiple females paired to the same male across a season get closer to the statistical expectation because the sample size is bigger. A breeder running one pairing per season lives and dies by variance.
Example Pairing Walkthrough: Pastel het Puzzle x Puzzle
Here is a real scenario you might plug into a ball python morph calculator. Your male is a Pastel het Puzzle. Your female is a visual Puzzle (homozygous; two copies of the recessive Puzzle gene).
The Puzzle gene is recessive. Your female contributes one Puzzle allele to every offspring. Your male is het Puzzle, so he has one Puzzle allele and one normal allele. Each offspring has a 50% chance of receiving the Puzzle allele from the male. The result: 50% of offspring will be visual Puzzles (one copy from each parent), and 50% will be het Puzzles (one copy from the female only).
Now layer in the Pastel. Pastel is incomplete dominant. The male carries one copy. Each offspring has an independent 50% chance of inheriting it.
Combine both genes and the calculator gives you four possible outcomes:
- 25% Pastel Puzzle. Carries Pastel and is visual Puzzle. The money animal in this pairing.
- 25% Puzzle. Visual Puzzle, no Pastel. Still valuable. Still a visual recessive.
- 25% Pastel het Puzzle. Carries Pastel visually and is het for Puzzle. Your next generation breeder.
- 25% Normal het Puzzle. No visual morph, but carries one copy of Puzzle. Proven het from this pairing.
In a clutch of six, you might get two Pastel Puzzles and zero normals. Or four het Puzzles and nothing visual. The calculator tells you what is statistically expected. The eggs decide what you get.
The calculator tells you what's possible. Your program decides what's worth pursuing.
Strategic Pairing Decisions Beyond the Math
A ball python breeding odds calculator shows you genetic outcomes. It does not show you business outcomes. And every pairing is a business decision whether you treat it like one or not.
Market Demand vs. Personal Projects
You can produce the most genetically impressive animal in the room and still not sell it if the market is not buying. Some morphs move fast. Some sit for months. A ball python pairing calculator tells you the odds of producing a Banana Pied. It does not tell you whether Banana Pieds are still selling at the price they were two seasons ago.
Strategic breeders run the calculator and then check the market. What is moving on MorphMarket? What are buyers asking for in the groups? What price points are clutch averages landing at for the morphs in your predicted outcomes? The genetics math is step one. The market math is step two.
Multi-Gene Stacking
The most valuable animals in the market are multi-gene combos. A single-gene Pastel is a different conversation than a Pastel Puzzle Pied. But stacking genes means compounding probabilities. The more genes involved, the smaller the percentage chance of hitting the exact combination you want in any single offspring.
Three-gene combos from a pairing with the right het structure might have a 3% to 6% chance per egg. You need volume or patience. Either more females carrying the right genes, or a willingness to hold back and breed the next generation. The calculator shows you the long game clearly. The question is whether you are set up to play it.
This is where a project planner changes the equation. Instead of running one-off calculations and trying to hold the multi-generation picture in your head, you map it out. Season one produces the holdbacks. Season two pairs them to the right animals. Season three hits the target combo. THE RACK's project planner is built for this. Define your genetic goal, and the system helps you plot each generation's pairings to get there.
The Holdback Calculation
Every breeder faces this choice after a clutch hatches: sell or hold back? A ball python morph calculator helps before the pairing, but the holdback question is where strategy lives. An animal with a 25% chance of producing your dream combo when paired next season is worth more in your rack than on MorphMarket; if your program can absorb the carrying cost for another year.
Feed, space, time. Those costs are real. A holdback with clear genetic value toward your breeding goals is an investment. A holdback you are keeping because you are emotionally attached is a liability the numbers will not forgive.
Beyond Probabilities
The best pairing is not the one with the most exciting odds. It is the one aligned with your program goals and your market.
Where Calculators Fall Short
A ball python genetics calculator is a powerful tool. It is also a limited one. Here is what no standalone calculator can do.
They Do Not Account for Market Value
A calculator tells you the probability of producing a Pastel Puzzle. It does not tell you the current market price, the price trend over the last two seasons, or whether demand is rising or falling. You can produce the right animal at the wrong time and still lose money on the season.
They Do Not Connect to Your Collection
Standalone calculators require manual input every time. You type in the sire's genetics. You type in the dam's genetics. You read the output. Then you close the tab and do it again for the next pairing. There is no memory. No connection to the animals you own, the pairings you have already tried, or the offspring you have already produced.
For a breeder running ten or twenty pairings per season, re-entering genetics data for every hypothetical combination is tedious and error-prone. One wrong checkbox on a het status changes the entire output.
THE RACK's genetics calculator eliminates this entirely. It is built into the app, connected to your collection. Select a sire and dam from your animals, and the calculator already knows their full genetic profile. No re-entering data. No room for checkbox mistakes. Run pairings against animals you own in seconds.
Want this exact calculator for your breeding program?
Run pairings against animals you already own
THE RACK's genetics calculator pulls directly from your collection. Select a sire and dam, get instant probability breakdowns without re-entering a single gene.
Try the Free CalculatorThey Do Not Track What You Have Already Produced
You bred a Pastel het Puzzle to a Puzzle female last season and got three Puzzles and two Pastel het Puzzles. Good data. Useful for planning the next season. But the calculator does not remember it. Your historical breeding results; clutch outcomes, fertility rates, which males produced well with which females; live somewhere else. Or nowhere at all.
THE RACK tracks lineage across generations. Every pairing, every clutch, every offspring is connected back to the parents. When you are planning next season, you are not starting from scratch. You are building on the data your program has already generated.
They Do Not Tell You Which Pairings Align with Your Projects
If your two-year goal is to produce a visual Banana Puzzle Pied, the calculator can tell you the odds for any given pairing. But it cannot look at your full collection, identify which animals carry the right combination of genes and hets, and suggest the pairings most likely to move you toward your project goal. You do the cross-referencing yourself. Every time.
THE RACK's suggested pairings feature does this work for you. It analyzes the genetics across your collection and surfaces the combinations most likely to hit your targets. Combine it with the project planner, and every season's pairings are moving toward a defined outcome instead of floating on instinct and memory.
From Calculator to Complete System
THE RACK was built by a breeder who needed answers to all of these questions in one place. The genetics calculator runs pairings with probability breakdowns. The project planner maps multi-generation breeding goals. Suggested pairings analyze your collection's genetics and surface optimal combinations. Lineage tracking connects every animal back through its parents and grandparents so you can trace genetic history without a spreadsheet.
It is the difference between a calculator and facility management software designed to run your entire program. A calculator is where the conversation starts. A complete management system is where the work gets done.
Built by a Breeder
Stop re-entering genetics into
a standalone calculator
THE RACK connects genetics predictions to your collection, your breeding projects, and your lineage data. One system. Every pairing decision informed by your real program.
See THE RACKFree for up to 5 animals. Keeper $10/mo. Breeder $20/mo. 7-day money-back guarantee.